Ken Griffey Jr. was a cultural icon in the 1990s, with his
trendy Nikes, backwards cap, and room filling smile, no one person had made
baseball as cool as Junior did. Every kid who watched baseball in the 90s and is now an adult knows exactly
what a Ken Griffey homerun looked like and the famous strut when he knew he got
all of the ball. His swing was dubbed as the “Sweetest Swing in Baseball” for
its smoothness, and grace.
How good was Ken Griffey Jr.? At age 29 he was voted to the
All Century Baseball Team alongside the greatest outfielders of all time like
Hank Aaron, Babe Ruth, Willie Mays, and Mickey Mantle. Around the same time,
Hank Aaron said he believed Griffey would be the one who broke his All-Time
Home Run record of 755, and based on his 398 homeruns through age 29 it was
almost a certainty that his name would adorn the top of the list of baseball
immortality.
At age 40, Griffey faded off into the shadows retiring with
many asking the question ‘WHAT IF’. Griffey is undoubtedly a first ballot Hall
of Famer, and seen as the one guy who did it 'right in a time (Steroids Era)
where everyone was cheating to get the leg up.' Baseball historians still
wonder today if Ken Griffey could have gone down in baseball's history as the
mammoth character he was, rather than a tragic ending to a "What if."
Baseball is a game of numbers. Numbers rule everything in
analyzing baseball, and with the introduction of advanced Sabermetrics, numbers
are even more important to baseball. For a hitter, three categories rule; Hits,
Homeruns, and Runs Batted In. 3,000 hits, 500 homeruns, and 2,000 Runs Batted
In separate good from legendary in baseball.
Anyone who has seen Griffey play will tell you he was the
quintessential 5-tool player; Hit for average, hit for power, speed on the
basepaths, fielding ability, and arm strength. He was the type of player that
comes around once in a generation.
Now from my description, you would think Griffey had the
greatest numbers in baseball, but he is the prime example in sports of someone
great who couldn’t catch a break. Ending his career with 630 homeruns
(currently 6th all time),
1836 RBI’s (currently 15th All Time), and 2,781 hits (49th
all-time). Hall of Fame numbers that someone should marvel at, but why do we say ‘WHAT-IF’ for “The Kid” as he was nickname due to his
boyish smile that was still prevalent even as a worn 22 year veteran at age 40.
1994:
Nevertheless, Griffey ended the season playing 111 of 113 Seattle Mariner games, hitting 40 Homeruns, 90 RBIs, and 140 Hits.
1995:
Video of the injury: http://mlb.mlb.com/video/play.jsp?content_id=3850092&topic_id=10728310&c_id=mlb&tcid=vpp_copy_3850092&v=3
Randy Johnson who is considered one of the most intimidating pitchers in baseball history had a reaction as to how telling the injury was.
While missing 73 games due to injury, and 17 at the beginning of the season because of the strike of the previous year. Griffey had 17 homeruns, with 67 Hits and 42 RBIs.
Griffey would return, and produce one of the most memorable moments in the past few decades, and is called the play that “Saved Baseball in Seattle.” http://mlb.mlb.com/video/play.jsp?content_id=3850092&topic_id=10728310&c_id=mlb&tcid=vpp_copy_3850092&v=3
2001:
On September 11th 2000, Ken Griffey partially tore his hamstring at home plate when he collided with the catcher. On March 26, 2001 strained the same hamstring a week before opening day rounding third base in a spring training game. Griffey would play on opening day, but he was limited to Pinch Hitting for the entire month of April until April 28th. This is when Griffey aggravated his hamstring again forcing him to miss 41 games from April 29th – June 14th.
Griffey played 111 games. Hitting 22 homeruns, 65 RBI’s on 104 hits.
2002:
In his worst season of his career he missed 92 games (playing 72), hitting 8 Homeruns with 23 RBIs on 52 hits.
2003:
Griffey missed 111 games, hitting 13 homeruns on 26 rbis and 41 hits.
2004:
Griffey returned to the lineup on August 4th, and would experience heartbreak again that day. Griffey had recently been moved to right field (where he would play for the rest of his career) to spare him the constant strain Center Field has on one’s legs, a ball was hit to Right Center at AT&T Park in San Francisco, known for his all out play, Griffey did everything he could to prevent the ball from going to the wall. He slid to cut off the ball, and as he slid he hyper-extended his right leg, tearing the hamstring from the bone. Griffey would complain of tightness, but the frigid temperature of San Francisco masked the severity of the injury. Griffey was taken out of the game, and would pinch hit in the final two games of the series against the Giants. When an MRI was performed on Griffey’s legs because the tightness would not go away, his fate had been reveled once again and he would miss the final 53 games.
Griffey would miss 79 games hitting 20 homeruns 60 RBIs on 76 Hits.
2005:
2006:
2007:
2008-2010:
1994:
1994 was a truly historic and disappointing year for
baseball. The Expos & Yankees were destined for a World Series Matchup
(which may have destroyed baseball in Montreal), and potential record
shattering years was cut short by 49-51 games across the Major Leagues when a
strike between the Players Association and MLB began on August 12, 1994
cancelling the World Series for the first time in 90 years.
As Ken Griffey explained “We picked a bad season to have a
good year.” Griffey and Matt Williams had 40 and 43 homeruns, respectively. At
the time Roger Maris’ 61 homeruns in a season was the record, and Williams was
on pace to tie it. Griffey was on pace for 58 homeruns.
Nevertheless, Griffey ended the season playing 111 of 113 Seattle Mariner games, hitting 40 Homeruns, 90 RBIs, and 140 Hits.
1995:
Due to the strike of the previous year carrying into the
1995 season, each team lost 17 games. But that was not the only thing that
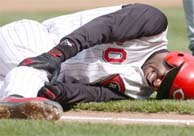
limited Griffey. On May 26th, a fly ball to deep right center field
hit by Kevin Bass was caught by Junior, but on the play he fractured his wrist
as he collided with the wall. He had a metal plate inserted into his wrist, with 7
screws drilled into his right wrist. Forcing him to miss 73 games from May 26th
to August 15th.
Video of the injury: http://mlb.mlb.com/video/play.jsp?content_id=3850092&topic_id=10728310&c_id=mlb&tcid=vpp_copy_3850092&v=3
Randy Johnson who is considered one of the most intimidating pitchers in baseball history had a reaction as to how telling the injury was.
While missing 73 games due to injury, and 17 at the beginning of the season because of the strike of the previous year. Griffey had 17 homeruns, with 67 Hits and 42 RBIs.
Griffey would return, and produce one of the most memorable moments in the past few decades, and is called the play that “Saved Baseball in Seattle.” http://mlb.mlb.com/video/play.jsp?content_id=3850092&topic_id=10728310&c_id=mlb&tcid=vpp_copy_3850092&v=3
2001:
Griffey remained relatively injury free for the next 5 years
averaging 49.8 Homeruns per year. Starting in 2000 began The Tragedy of the
Kid, and one of the worst 10 years a player could endure derailing a Hall of
Fame Career from being arguably the greatest ever.
On September 11th 2000, Ken Griffey partially tore his hamstring at home plate when he collided with the catcher. On March 26, 2001 strained the same hamstring a week before opening day rounding third base in a spring training game. Griffey would play on opening day, but he was limited to Pinch Hitting for the entire month of April until April 28th. This is when Griffey aggravated his hamstring again forcing him to miss 41 games from April 29th – June 14th.
Griffey played 111 games. Hitting 22 homeruns, 65 RBI’s on 104 hits.
2002:
People began worrying about Griffey’s health as he had 2
injuries of the same hamstring in as many seasons. 2002 would only deepen the
concern. During a rundown play on April 7, 2002, Griffey dislocated his kneecap
and tore his patellar tendon. He missed another 41 games coming back on May 24th. On June 23rd, Griffey again
injured his hamstring and he missed 25 games between June 24th- July
22nd. In September of 2002 Griffey missed 13 games to rest his legs,
and 8 of the 15 games he played were to pinch hit.
In his worst season of his career he missed 92 games (playing 72), hitting 8 Homeruns with 23 RBIs on 52 hits.
2003:
Another season cut short. On April 5th, Griffey
dislocated his right shoulder diving for a fly ball. He missed 33 games.
Griffey would go onto hit 12 homeruns over the next 48 games. He seemed to be
getting on the right track, but in the first game after the All-Star Break,
Griffey tore the tendon in his right ankle causing him to miss the rest of the
season.
Griffey missed 111 games, hitting 13 homeruns on 26 rbis and 41 hits.
2004:
Griffey again seemed to be on track to be the All-Star he
once was, and he was selected to the 2003 All-Star Game. Playing in 80 of the
first 87 games. Hitting 20 Homeruns with 60 RBIs including his 500th
Homerun on Father’s Day. On July 10th, he partially tore his
hamstring again, causing him to miss 19 games, and the miss his first All-Star
selection since 2000.
Reds Manager Dave Miley said "Until this, it's probably
the best he's felt in a long time."
Griffey returned to the lineup on August 4th, and would experience heartbreak again that day. Griffey had recently been moved to right field (where he would play for the rest of his career) to spare him the constant strain Center Field has on one’s legs, a ball was hit to Right Center at AT&T Park in San Francisco, known for his all out play, Griffey did everything he could to prevent the ball from going to the wall. He slid to cut off the ball, and as he slid he hyper-extended his right leg, tearing the hamstring from the bone. Griffey would complain of tightness, but the frigid temperature of San Francisco masked the severity of the injury. Griffey was taken out of the game, and would pinch hit in the final two games of the series against the Giants. When an MRI was performed on Griffey’s legs because the tightness would not go away, his fate had been reveled once again and he would miss the final 53 games.
Griffey would miss 79 games hitting 20 homeruns 60 RBIs on 76 Hits.
2005:
Griffey was on fire in 2005. Playing 128 of the first 137
games. Hitting 35 Homeruns on 92 RBIs at age 36. The Kid was officially back.
He won the National League Comeback Player of the Year Award. But even a great
comeback for Griffey, did not mean a great ending. He missed the last 25 games
with a strained tendon in his left foot. He was listed as day-to-day for
several weeks, until on September 22nd, he was benched for the rest
of the season to have arthroscopic surgery on his left knee, and another
surgery to repair scars caused by surgery in 2004 on his hamstring.
2006:
On April 12, Griffey left the game with inflammation in a
tendon behind his right knee. He was placed on the disabled list on April 17,
and returned May 11th missing a total of 26 games. Griffey would go
on to play 99 of the next 103 games, hitting 24 homeruns, 62 RBIs and 99hits.
On September 4th, Griffey had another injury this time a dislocated
toe in his right foot forcing him to miss 17 more games.
In 109 games, Griffey was able to put up 27 Homeruns, 72 RBIs
and 108 Hits.
2007:
Griffey was having another solid year when healthy. Playing
in 144 of the first 152 games. Then a
strained groin caused him to miss the last 10 games of the season.
Griffey hit 30 homeruns, with 93 RBIs with 146 hits.
2008-2010:
Griffey remained
healthy in comparison for the last stint of his career, but it was clearly the
twilight of his career. His hitting suffered, and like father time has done to
so many athletes, Griffey was no longer The Kid.
With the Reds & White Sox in 2008 Griffey hit 18
Homeruns, 71 RBIs, 122 hits in 143 games.
2009 saw the return of Griffey to Seattle, he was
not an everyday player anymore and was the Designated Hitter, rarely playing in
the field. Griffey had 19 Homeruns, 57 RBIs, and 83 hits.
To many fans, it was evident that 2010 would be his last season. Hitting an abysmal .214 from the plate in 2009, made it clear that Griffey had become too old, and his athleticism that amazed the country was finally gone.
To many fans, it was evident that 2010 would be his last season. Hitting an abysmal .214 from the plate in 2009, made it clear that Griffey had become too old, and his athleticism that amazed the country was finally gone.
2010 was a very tumultuous final season for Griffey.
He hit .184 in 33 games.18 hits in 98 at bats, 0 Homeruns, and 7 RBIs. There
were stories of Griffey missing a pinch hitting opportunity because he fell
asleep in the Mariners Clubhouse. He was also taken out of the lineup in
late-May due to his lack of hitting. His game winning hit on May
20th was his last hit in the Major Leagues. He retired on June 2nd,
2010
Griffey released a statement saying “While I feel I
am still able to make a contribution on the field and nobody in the Mariners
front office has asked me to retire, I told the Mariners when I met with them
prior to the 2009 season and was invited back that I will never allow myself to
become a distraction. I feel that without enough occasional starts to be
sharper coming off the bench, my continued presence as a player would be an
unfair distraction to my teammates and their success as a team is what the
ultimate goal should be.”
It is clear that the question be asked “WHAT IF”. What if
Griffey stayed healthy? What would his stats look like.
Griffey’s averages are the tale of two sagas. One where he
ruled baseball, and one where he became injury-prone.
Year
|
G
|
AB
|
H
|
HR
|
RBI
|
Batting Avg.
|
1989-2000
|
140
|
529
|
157
|
36
|
106
|
.296
|
2001-2010
|
99
|
345
|
90
|
19
|
57
|
.260
|
CAREER Totals
|
2671
|
9801
|
2781
|
630
|
1836
|
.284
|
WHAT IF:
Premise:
1.
Griffey’s stats are assuming that Griffey would
play 90% of games he missed. 90% is assuming he sits a few games a month for
the occasional rest
2.
Stats are determined in a number of ways
3.
All decimals for Games, At-Bats, Hits, Home Runs,
RBIs are rounded up
Games:
1.
Total Played + Playing 90% of games missed
2.
Any decimal is rounded up (44.1 = 45 games)
At-Bats:
1.
Determined by At-Bats per Game in Games he
played for that season
2.
Multiple At-Bats per game by total of 90% of
games missed.
3.
Add Actual At-Bats per Game, by Step 2 Answer
Hits:
1.
Find At-Bats per Hit
2.
Find Hits per Game
3.
The calculation of both are used to determine
how many hits Griffey would have had based on Games Missed & At Bats missed.
4.
The total of both is averaged, and the average
is added to actual hit total
Home Runs
1.
Find At-Bats per homerun for that year.
2.
At-BatsMissed / AB/HR
3.
Add that number to actual total
RBIs
1.
Determine AB per RBI
2.
Determine RBIs per Game
3.
Average both
multiplied by 90% of missed games played
4.
Add answer to actual total
1994:
What if the MLB didn’t go on Strike?
Year
|
G
|
AB
|
H
|
HR
|
RBI
|
Batting Avg.
|
1994
|
111
|
433
|
140
|
40
|
90
|
.323
|
Games:
Griffey played 111 of 113 games that season. The MLB strike
cost Griffey the final 49 Mariners Games.
90% of 49 games = 44.1 games. Round up to 45 games
Game Total = 146 games played.
At-Bats:
433 / 111 = 3.900 AB/G
45 x 3.900 = 175.5 missed At-Bats. Rounded to 176.
At Bats Total = 609
at bats.
Hits:
AB/Hit
433 / 140 = 3.09 AB’s/Hit
140/111 = 1.26 Hits / Game
45 games missed x 1.26 Hits/Game = 56.7 Hits missed
176 At- Bats / 3.09 AB’s/Hit = 56.957 Hits missed
Rounded up 57 Hits missed.
Hits Total = 197 Hits
Homeruns:
AB’s/ HR = 433 / 40 =
10.3 AB’s / HR
176 at-bats / 10.3 HR/At- Bats = 17.08. Rounded up to 18
Homeruns missed
HomeRun Total = 58 Home Runs
RBI’s
AB/RBI = 433 / 90 = 4.81 AB’s/RBI
RBI per Game = 90 /
111 = .81 RBIs / Game
176 missed at Bats / 4.81 AB’s / RBI = 36.59 RBIs missed
45 games missed x .81 RBI/game = 36.45
Rounded up to 37 RBIs missed
90 + 37 = 127 RBIs
1994
|
G
|
AB
|
H
|
HR
|
RBI
|
Avg.
|
ACTUAL
|
111
|
433
|
140
|
40
|
90
|
.323
|
PROJECTED
|
146
|
609
|
197
|
58
|
127
|
.323
|
1995:
Year
|
G
|
AB
|
H
|
HR
|
RBI
|
Batting Avg.
|
1995
|
72
|
260
|
67
|
17
|
42
|
.258
|
Games:
90 Games Missed due to broken wrist + strike at beginning of
the season.
90 x 90% = 81 games
missed
81 + 72 games actually played = 153 games
At-Bats:
260 / 72 = 3.61 AB’s / Game
81 x 3.61 = 292.4 at-bats missed. Rounded to 293.
260 + 293 = 553 Total
At-Bats
Hits:
AB/Hit : 260 / 67 = 3.88 AB’s/Hit
67/ 72 = .93 Hits /
Game
81 games missed x .93
Hits/Game = 75.33 Hits missed
293 At- Bats missed/ 3.88 AB’s/Hit = 75.51 Hits missed
Rounded up 76 Hits missed.
Hits Total = 143 Hits
Homeruns:
AB’s/ HR = 260 / 17 =
15.29 AB’s / HR
293 at-bats / 15.29 HR/At- Bats = 19.16. Rounded up to 20
Homeruns missed
HomeRun Total = 37 Home Runs
RBI’s
AB/RBI = 260 / 42 = 6.19 AB’s/RBI
RBI per Game = 42 / 72
= .58 RBIs / Game
293 missed at Bats / 6.19 AB’s / RBI = 47.33 RBIs missed
81 games missed x .58 RBI/game = 46.98
Rounded up to 48 RBIs missed
42 + 48 = 90 RBIs
1995
|
G
|
AB
|
H
|
HR
|
RBI
|
Avg.
|
ACTUAL
|
72
|
260
|
67
|
17
|
42
|
.258
|
PROJECTED
|
153
|
553
|
143
|
37
|
90
|
.258
|
2001:
Year
|
G
|
AB
|
H
|
HR
|
RBI
|
Batting Avg.
|
2001
|
111
|
364
|
104
|
22
|
65
|
.286
|
Games:
41 Games Missed due Hamstring Injuries
41 x 90% = 37 games
missed
37 + 111 games actually played = 148 games
At-Bats:
364 / 111 = 3.279 AB’s / Game
37 x 3.279 = 121.3 at-bats missed. Rounded to 122.
364 + 122 = 486 Total
At-Bats
Hits:
AB/Hit : 364 / 104 = 3.5 AB’s/Hit
104/ 111 = .936 Hits
/ Game
37 games missed x .936
Hits/Game = 34.632 Hits missed
122 At- Bats missed/ 3.5 AB’s/Hit = 34.857 Hits missed
Rounded up 35 Hits missed.
Hits Total = 139 Hits
Homeruns:
AB’s/ HR = 364 / 22 =
16.54 AB’s / HR
122 at-bats / 16.54 HR/At- Bats = 7.37. Rounded up to 8
Homeruns missed
HomeRun Total = 30 Home Runs
RBI’s
AB/RBI = 364 / 65 = 5.6
AB’s/RBI
RBI per Game = 65 / 111
= .585 RBIs / Game
122 missed at Bats / 5.6
AB’s / RBI = 21.7 RBIs missed
37 games missed x .585
RBI/game = 21.645
Rounded up to 22 RBIs missed
65 + 22 = 87 RBIs
2001
|
G
|
AB
|
H
|
HR
|
RBI
|
Avg.
|
ACTUAL
|
111
|
364
|
104
|
22
|
65
|
.286
|
PROJECTED
|
148
|
486
|
139
|
30
|
87
|
.286
|
2002:
Year
|
G
|
AB
|
H
|
HR
|
RBI
|
Batting Avg.
|
2002
|
70
|
197
|
52
|
8
|
23
|
.264
|
Games:
79 Games Missed due torn patellar tendon, dislocated kneecap
and strained hamstring
79 x 90% = 72 games
missed
72 + 70 games actually played = 142 games
At-Bats:
197 / 70 = 2.814 AB’s / Game
72 x 2.814 = 202.6 at-bats missed. Rounded to 203.
197 + 203 = 400 Total
At-Bats
Hits:
AB/Hit : 197 / 52 = 3.78 AB’s/Hit
52/ 70 = .74 Hits /
Game
72 games missed x .74
Hits/Game = 53.28 Hits missed
203 At- Bats missed/ 3.78 AB’s/Hit = 53.7 Hits missed
Rounded up 54 Hits missed.
Hits Total = 106 Hits
Homeruns:
AB’s/ HR = 197 /8 = 24.625
AB’s / HR
203 at-bats / 24.625 HR/At- Bats = 8.243. Rounded up to 9
Homeruns missed
HomeRun Total = 17 Home Runs
RBI’s
AB/RBI = 197 / 23 = 8.565
AB’s/RBI
RBI per Game = 23 / 70
= .328 RBIs / Game
203 missed at Bats / 8.95
AB’s / RBI = 23.7 RBIs missed
72 games missed x .328
RBI/game = 23.616
Rounded up to 24 RBIs missed
23 + 24 = 47 RBIs
2002
|
G
|
AB
|
H
|
HR
|
RBI
|
Avg.
|
ACTUAL
|
70
|
197
|
52
|
8
|
23
|
.264
|
PROJECTED
|
142
|
400
|
106
|
17
|
47
|
.264
|
2003:
Year
|
G
|
AB
|
H
|
HR
|
RBI
|
Batting Avg.
|
2003
|
53
|
166
|
41
|
13
|
26
|
.247
|
Games:
101 Games Missed due Dislocated Right Shoulder, Torn Tendon
in Right Ankle.
101 x 90% = 91 games
missed
91 + 53 games actually played = 144 games
At-Bats:
166 / 53 = 3.13 AB’s / Game
91 x 3.13 = 284.83 at-bats missed. Rounded to 285.
166 + 285 = 451 Total
At-Bats
Hits:
AB/Hit : 166 / 41 = 4.04 AB’s/Hit
41/ 53 = .77 Hits /
Game
91 games missed x .77
Hits/Game = 70.07 Hits missed
285 At- Bats missed/ 4.04 AB’s/Hit = 70.5 Hits missed
Rounded up 71 Hits missed.
Hits Total = 112 Hits
Homeruns:
AB’s/ HR = 166 /13 = 12.769
AB’s / HR
285 at-bats / 12.769 HR/At- Bats = 22.319. Rounded up to 23
Homeruns missed
HomeRun Total = 36 Home Runs
RBI’s
AB/RBI = 166 / 26 = 6.384
AB’s/RBI
RBI per Game = 26 / 53
= .49 RBIs / Game
285 missed at Bats / 6.384
AB’s / RBI = 44.64 RBIs missed
91 games missed x .49
RBI/game = 44.59
Rounded up to 45 RBIs missed
26 + 45 = 71 RBIs
2003
|
G
|
AB
|
H
|
HR
|
RBI
|
Avg.
|
ACTUAL
|
53
|
166
|
41
|
13
|
26
|
.247
|
PROJECTED
|
144
|
451
|
112
|
36
|
71
|
.247
|
2004:
Year
|
G
|
AB
|
H
|
HR
|
RBI
|
Batting Avg.
|
2004
|
83
|
300
|
76
|
20
|
60
|
.253
|
Games:
72 Games Missed due 2 separate tears of his hamstring.
72 x 90% = 65 games
missed
65 + 83 games actually played = 148 games
At-Bats:
300 / 83 = 3.614 AB’s / Game
65 x 3.614 = 234.91 at-bats missed. Rounded to 235.
300 + 235 = 535 Total
At-Bats
Hits:
AB/Hit : 300 / 76 = 3.947 AB’s/Hit
76/ 83 = .9156 Hits /
Game
65 games missed x .9156
Hits/Game = 59.514 Hits missed
235 At- Bats missed/ 3.947 AB’s/Hit = 59.538 Hits missed
Rounded up 60 Hits missed.
Hits Total = 136 Hits
Homeruns:
AB’s/ HR = 300 /20 =
15 AB’s / HR
235 at-bats / 15 HR/At- Bats = 15.66. Rounded up to 16
Homeruns missed
HomeRun Total = 36 Home Runs
RBI’s
AB/RBI = 300 / 60 = 5 AB’s/RBI
RBI per Game = 60 / 83
= .722 RBIs / Game
235 missed at Bats / 5
AB’s / RBI = 47 RBIs missed
65 games missed x .722
RBI/game = 46.93
Rounded up to 47 RBIs missed
60 + 47 = 107 RBIs
2004
|
G
|
AB
|
H
|
HR
|
RBI
|
Avg.
|
ACTUAL
|
83
|
300
|
76
|
20
|
60
|
.253
|
PROJECTED
|
148
|
535
|
136
|
36
|
107
|
.253
|
2005:
Year
|
G
|
AB
|
H
|
HR
|
RBI
|
Batting Avg.
|
2005
|
128
|
491
|
148
|
35
|
92
|
.301
|
Games:
25 games Strained Tendon + Early End of Season for
Arthroscopic surgery
25 x 90% = 23 games
missed
23 + 128 games actually played = 151 games
At-Bats:
491 / 128 = 3.835 AB’s / Game
23 x 3.835 = 88.205 at-bats missed. Rounded to 89.
491 + 89 = 580 Total
At-Bats
Hits:
AB/Hit : 491 / 148 = 3.317 AB’s/Hit
148/ 128 = 1.156 Hits
/ Game
23 games missed x 1.156
Hits/Game = 26.588 Hits missed
89 At- Bats missed/ 3.317 AB’s/Hit = 26.831 Hits missed
Rounded up 27 Hits missed.
Hits Total = 175 Hits
Homeruns:
AB’s/ HR = 491 /35 =
14.02 AB’s / HR
89 at-bats / 14.02 HR/At- Bats = 6.34. Rounded up to 7
Homeruns missed
HomeRun Total = 42 Home Runs
RBI’s
AB/RBI = 491 / 92 = 5.33 AB’s/RBI
RBI per Game = 92 /
128 = .718 RBIs / Game
89 missed at Bats / 5.33
AB’s / RBI = 16.697 RBIs missed
23 games missed x .718
RBI/game = 16.514
Rounded up to 17 RBIs missed
92 + 17 = 109 RBIs
2005
|
G
|
AB
|
H
|
HR
|
RBI
|
Avg.
|
ACTUAL
|
128
|
491
|
148
|
35
|
92
|
.301
|
PROJECTED
|
151
|
580
|
175
|
42
|
109
|
.301
|
2006:
Year
|
G
|
AB
|
H
|
HR
|
RBI
|
Batting Avg.
|
2006
|
109
|
428
|
108
|
27
|
72
|
.252
|
Games:
43 games missed due to inflammation in right knee &
dislocated toe
43 x 90% = 39 games
missed
39 + 109 games actually played = 148 games
At-Bats:
428 / 108 = 3.962 AB’s / Game
39 x 3.962 = 154.518 at-bats missed. Rounded to 155.
428 + 155 = 583 Total
At-Bats
Hits:
AB/Hit : 428 / 108 = 3.962 AB’s/Hit
108/ 109 = .99 Hits /
Game
39 games missed x .99
Hits/Game = 38.61 Hits missed
155 At- Bats missed/ 3.962 AB’s/Hit = 39.121 Hits missed
Rounded up 39 Hits missed.
Hits Total = 147 Hits
Homeruns:
AB’s/ HR = 428 /27 =
15.851 AB’s / HR
155 at-bats / 15.5581 HR/At- Bats = 9.77. Rounded up to 10
Homeruns missed
HomeRun Total = 37 Home Runs
RBI’s
AB/RBI = 428 / 72 = 5.944 AB’s/RBI
RBI per Game = 72 / 109
= .660 RBIs / Game
155 missed at Bats / 5.944
AB’s / RBI = 26.076 RBIs missed
39 games missed x .660
RBI/game = 25.74
Rounded up to 26 RBIs missed
72 +26 = 98 RBIs
2006
|
G
|
AB
|
H
|
HR
|
RBI
|
Avg.
|
ACTUAL
|
109
|
428
|
108
|
27
|
72
|
.252
|
PROJECTED
|
148
|
583
|
147
|
37
|
98
|
.252
|
2007:
I will not aggregate the stats for 2007 because he missed
only 10 games to injury at the end of the year. At 37 it seems plausible to
assume missing 10 games for an injury playing in his 19th season.
2008-2010:
This will not be changed either because it would be
impossible to say Griffey wouldn’t have a decline at this point in his career.
I think he would have played better in his last 2 full seasons if he had been
healthy his entire, but we will consider it similar to the career of Willie
Mays when he played for the Mets. At some point you must go down, and Griffey
showed he still could play at a high caliber through 2007, but 2008 was when he
began to decline rapidly.
ACTUAL STATS:
Year
|
G
|
AB
|
H
|
HR
|
RBI
|
Avg
|
1989
|
127
|
455
|
120
|
16
|
61
|
.264
|
1990
|
155
|
597
|
179
|
22
|
80
|
.300
|
1991
|
154
|
548
|
179
|
22
|
100
|
.327
|
1992
|
142
|
5655
|
174
|
27
|
103
|
.308
|
1993
|
156
|
582
|
180
|
45
|
109
|
.309
|
1994
|
111
|
433
|
140
|
40
|
90
|
.323
|
1995
|
72
|
260
|
67
|
17
|
42
|
.258
|
1996
|
140
|
545
|
165
|
49
|
140
|
.303
|
1997
|
157
|
608
|
185
|
56
|
147
|
.304
|
1998
|
161
|
633
|
180
|
56
|
146
|
.284
|
1999
|
160
|
606
|
173
|
48
|
134
|
.285
|
2000
|
145
|
520
|
141
|
40
|
118
|
.271
|
2001
|
111
|
364
|
104
|
22
|
65
|
.286
|
2002
|
70
|
197
|
52
|
8
|
23
|
.264
|
2003
|
53
|
166
|
41
|
13
|
26
|
.247
|
2004
|
83
|
300
|
76
|
20
|
60
|
.253
|
2005
|
128
|
491
|
148
|
35
|
92
|
.301
|
2006
|
109
|
428
|
108
|
27
|
72
|
.252
|
2007
|
144
|
528
|
146
|
30
|
93
|
.277
|
2008
|
143
|
490
|
122
|
18
|
71
|
.249
|
2009
|
117
|
387
|
83
|
19
|
57
|
.214
|
2010
|
33
|
98
|
18
|
0
|
7
|
.184
|
CAREER TOTALS
|
2671
|
9801
|
2781
|
630
|
1836
|
.284
|
PROJECTED CAREER STATS:
Year
|
G
|
AB
|
H
|
HR
|
RBI
|
Avg
|
1989
|
127
|
455
|
120
|
16
|
61
|
.264
|
1990
|
155
|
597
|
179
|
22
|
80
|
.300
|
1991
|
154
|
548
|
179
|
22
|
100
|
.327
|
1992
|
142
|
565
|
174
|
27
|
103
|
.308
|
1993
|
156
|
582
|
180
|
45
|
109
|
.309
|
1994
|
146
|
609
|
197
|
58
|
127
|
.323
|
1995
|
153
|
553
|
143
|
37
|
90
|
.258
|
1996
|
140
|
545
|
165
|
49
|
140
|
.303
|
1997
|
157
|
608
|
185
|
56
|
147
|
.304
|
1998
|
161
|
633
|
180
|
56
|
146
|
.284
|
1999
|
160
|
606
|
173
|
48
|
134
|
.285
|
2000
|
145
|
520
|
141
|
40
|
118
|
.271
|
2001
|
148
|
486
|
139
|
30
|
87
|
.286
|
2002
|
142
|
400
|
106
|
17
|
47
|
.264
|
2003
|
144
|
451
|
112
|
36
|
71
|
.247
|
2004
|
148
|
535
|
136
|
36
|
107
|
.253
|
2005
|
151
|
580
|
175
|
42
|
109
|
.301
|
2006
|
148
|
583
|
147
|
37
|
98
|
.252
|
2007
|
144
|
528
|
146
|
30
|
93
|
.277
|
2008
|
143
|
490
|
122
|
18
|
71
|
.249
|
2009
|
117
|
387
|
83
|
19
|
57
|
.214
|
2010
|
33
|
98
|
18
|
0
|
7
|
.184
|
CAREER TOTALS
|
3114
|
11,359
|
3200
|
741
|
2106
|
.284
|
Griffey missed:
443 games (Moves from
31st to 4th)
1,558 At-Bats (Moves
from 32nd to 6th)
419 Hits (Moves from
49th to 15th)
111 Homeruns (Moves
from 6th to 3rd)
270 Runs Batted In
(Moves from 15th to 3rd)
Of course my projections are not an exact science because
who knows what would have happened if Griffey played those games. It’s unlikely
that surrounded by years where he’d hit 30+ Homeruns, that he’d hit only 17,
playing a similar amount of games in 2002. But to keep it fair each number is
found by how he was playing when he wasn’t injured in the season. This means years where
injury took a toll on his performance and affected the projected stats. I’m merely
probing the question “WHAT IF?” There just isn’t a way to gauge where Griffey
would have been if he didn’t miss 400+ games to injuries.
When asked if he ever thought about what might have been, Griffey replied "Never" When asked why he didn't, he responded, "Because it doesn't matter."
Griffey is right. One cannot change the past. But for anyone who watched Griffey, it is difficult to not ask what if.
So let's remember Griffey for what he was.
No comments:
Post a Comment